Ares Management (ARES)·Q4 2025 Earnings Summary
Ares Management Crushes Q4 as AUM Crosses $620B, Dividend Jumps 20%
February 5, 2026 · by Fintool AI Agent
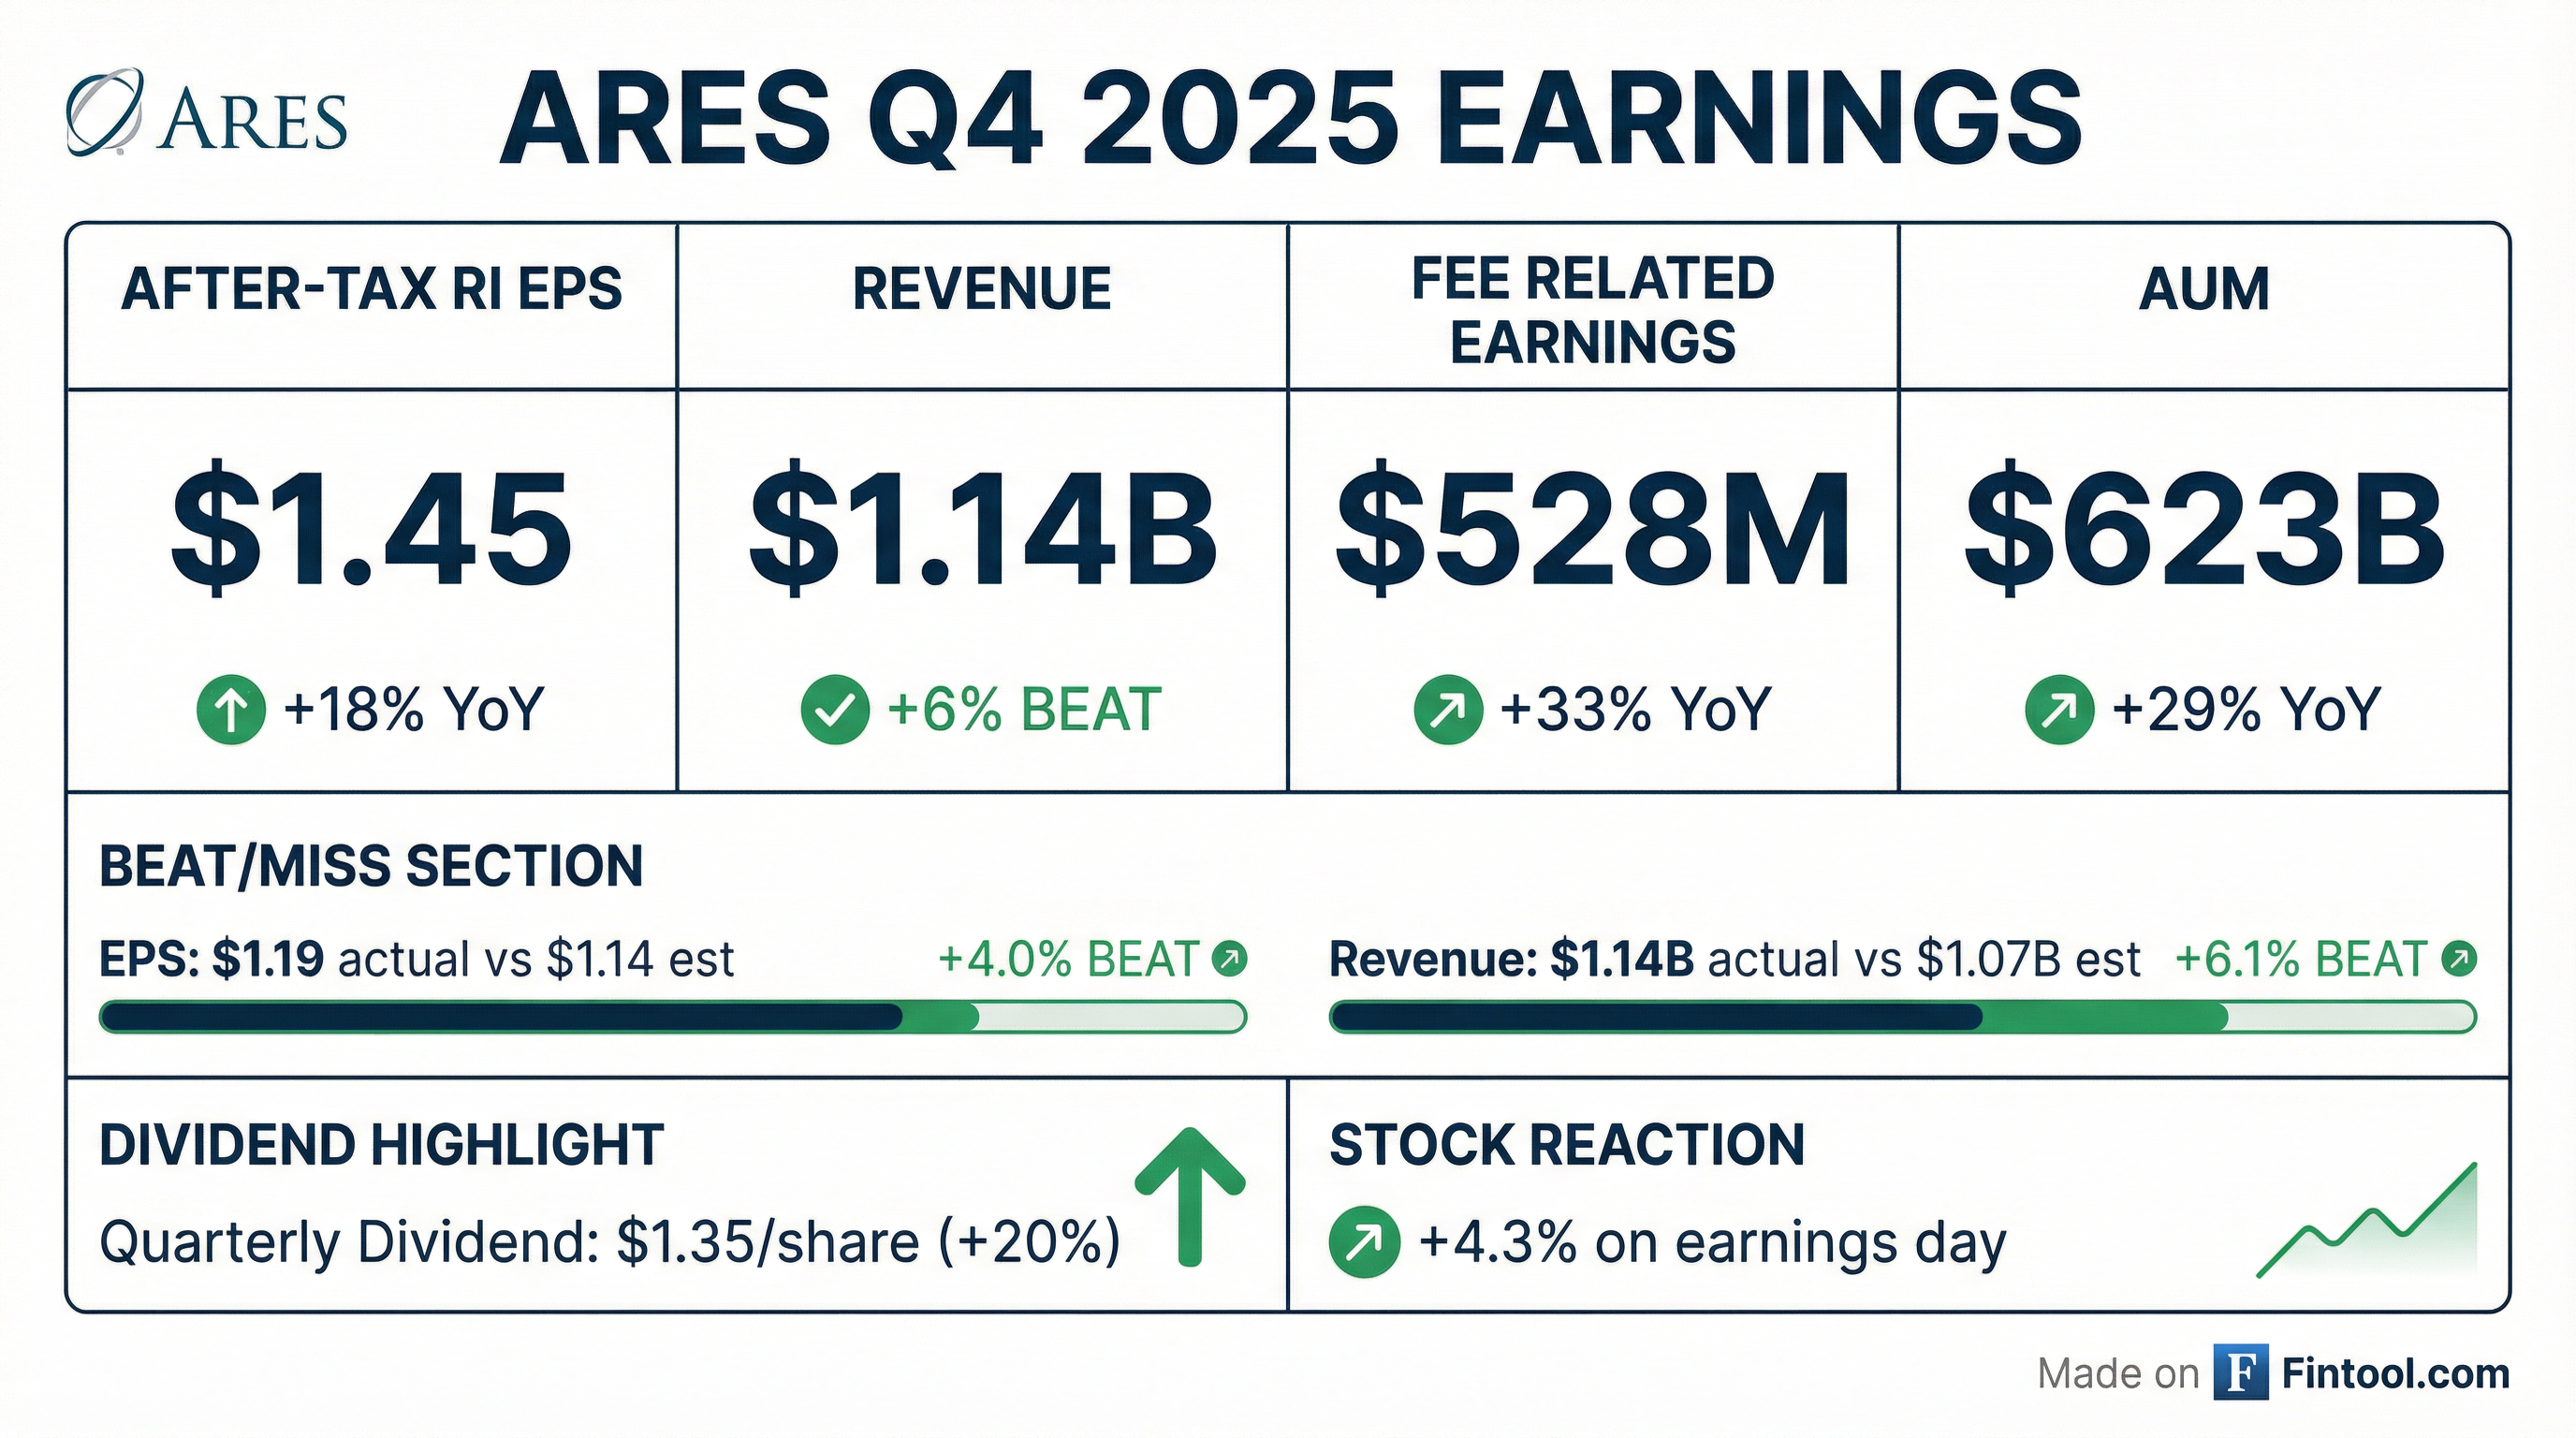
Ares Management (NYSE: ARES) delivered a standout Q4 2025, beating estimates across the board while crossing $620B in AUM and raising its dividend 20%. After-tax realized income hit $1.45 per share (+18% YoY), well ahead of consensus expectations. The results cap a milestone year that saw record fundraising ($113B), record deployment ($145.8B), and the transformative GCP International acquisition.
Did Ares Management Beat Earnings?
Yes — decisively. Ares beat on both the top and bottom lines:
Values retrieved from S&P Global and company filings
The headline beat was driven by strong management fee growth (+27% YoY), robust fee-related performance revenues ($171.2M), and continued momentum across the credit platform.
Ares has beaten EPS estimates in 6 of the last 8 quarters, with the only misses coming in Q1 2024 (seasonal weakness) and Q4 2024 (high bar from prior year).
What Did Management Guide?
CEO Michael Arougheti struck a bullish tone, stating fundraising expectations for 2026 should "meet or exceed" 2025's record levels:
2026 Financial Guidance:
Key Forward Indicators:
Upcoming Fund Launches:
What Changed From Last Quarter?
Several notable shifts this quarter:
1. GCP International Acquisition Closed
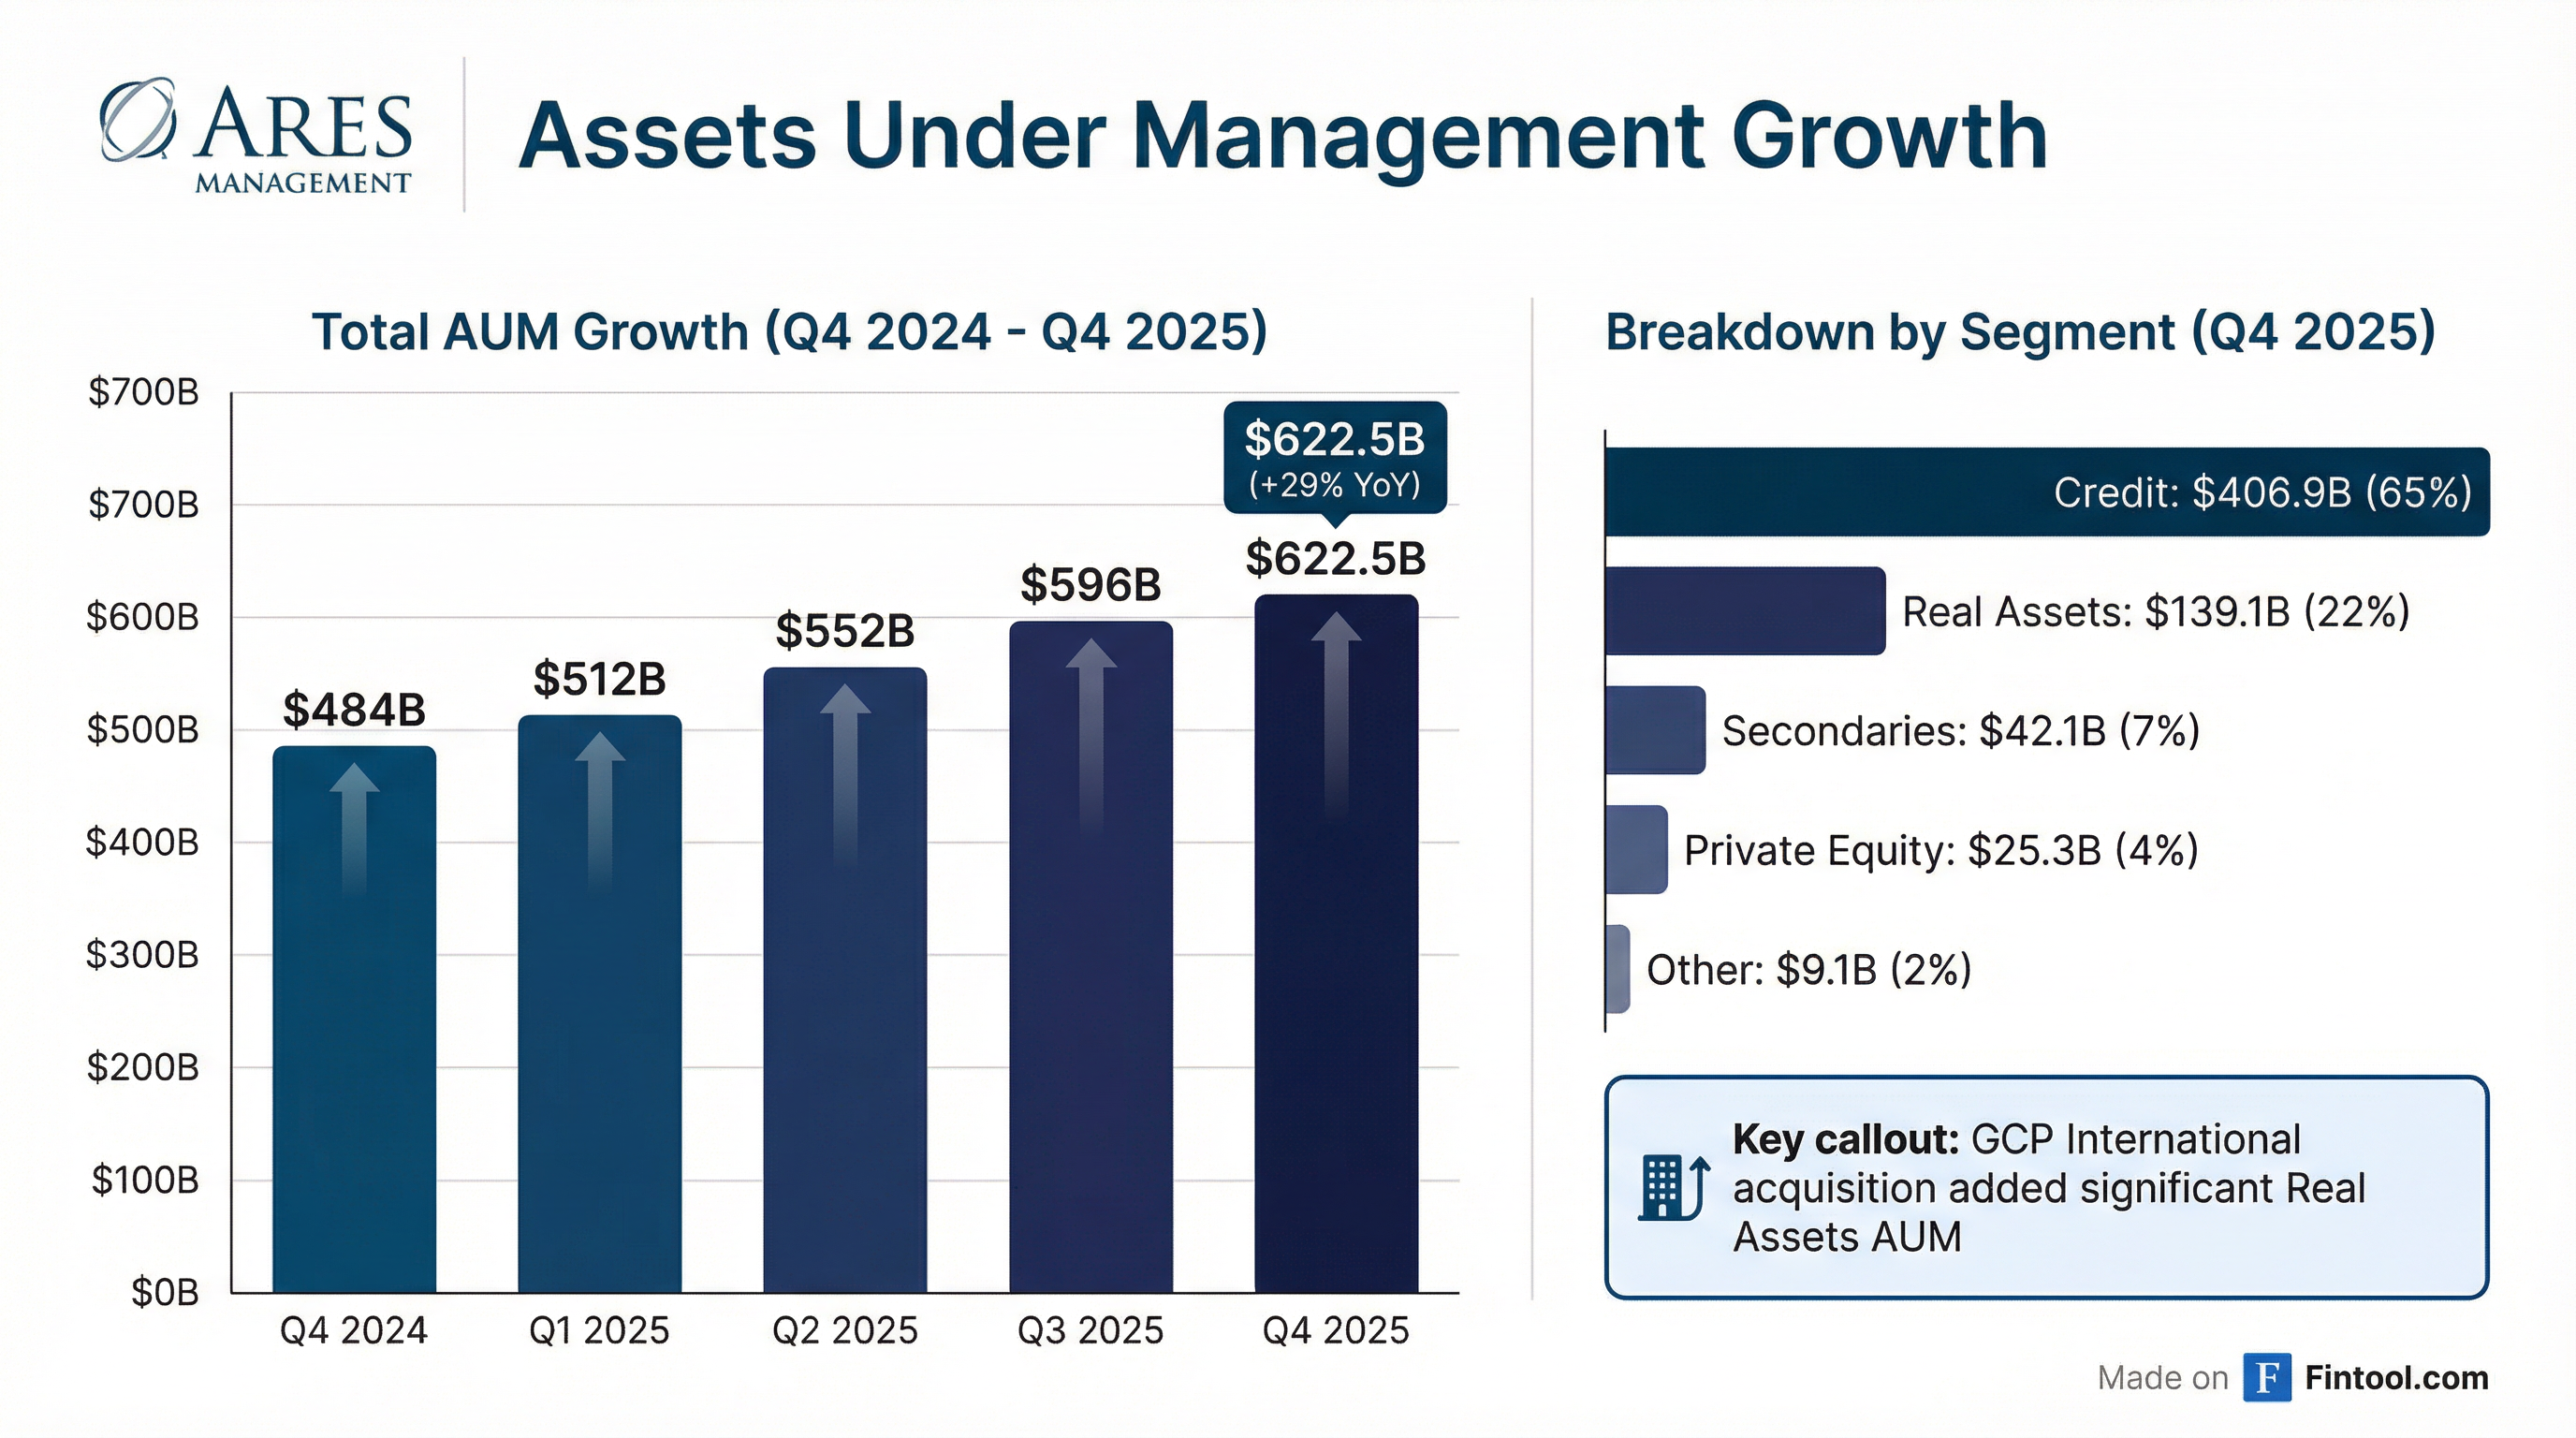
The transformative acquisition meaningfully broadened Ares' real estate and digital infrastructure capabilities. Real Assets AUM jumped 85% YoY to $139.1B, with the acquisition adding significant scale.
2. Dividend Raised 20%
Ares declared a quarterly dividend of $1.35 per share (up from $1.125), signaling confidence in the durability of fee-related earnings.
3. Record Perpetual Capital
Perpetual capital hit $200B (+50% YoY), now representing 32% of total AUM. This includes growth in BDCs, the open-ended European direct lending fund, and APMF.
4. Credit Group Continues to Dominate
The Credit Group generated $521.2M in FRE (+14% YoY), representing 99% of total company FRE this quarter. Management fees in credit rose 18% YoY.
How Did the Stock React?
The stock jumped +5.4% on February 4 ahead of the formal release, closing at $137.22. In aftermarket trading following the results, shares were quoted at $134.70 (-1.8%).*
Context matters: ARES is trading well below its 52-week high of $195.26 — down roughly 30%. The broader alternative asset manager sector has been under pressure amid concerns about private credit valuations and fundraising slowdown. This quarter's results should provide some reassurance on the fundraising front.
Capital Raising and Deployment
Ares raised $35.9B in gross new capital in Q4 and $113.2B for the full year — both records.
FY 2025 Fundraising by Segment:
Capital deployment was equally impressive: $45.8B in Q4 and $145.8B for the full year. Drawdown funds deployed $69.1B, while perpetual capital vehicles deployed $71.1B.
Segment Performance
Credit Group — The Core Engine
- AUM: $406.9B (+17% YoY)
- FPAUM: $249.8B (+19% YoY)
- Fee Related Earnings: $521.2M (+14% YoY)
- Deployment: $32.9B in Q4, $111.2B for FY
Credit Portfolio Health:
- US direct lending portfolio company EBITDA growth: 10% YoY
- Interest coverage: 2.2x (improving)
- Non-traded BDC: 0 non-accruals across ~900 portfolio companies, 9.3% net return
- ARCC (public BDC): 10.3% return on NAV, 1.8% non-accrual ratio at cost
- LTV ratios near historic lows in the 40% range
Real Assets Group — GCP Transforms the Platform
- AUM: $139.1B (+85% YoY)
- FRE: $150.6M (+162% YoY)
- Deployment: $10.0B in Q4, $23B+ for FY (more than doubled vs 2024)
Performance Highlights:
- Diversified non-traded REIT: 11.6% net return, #1 performer among 5 largest non-traded REIT peers
- Industrial non-traded REIT: #1 performing non-traded REIT over 5 years
- Open-end core infrastructure fund: 9.9% net return, now >$2.5B AUM
- Digital infrastructure (<2% of AUM) expected to be key contributor in 2026+
Secondaries Group — Record Year
- AUM: $42.1B (+45% YoY) — nearly doubled since Landmark acquisition in mid-2021
- FRE: $43.3M (+10% YoY)
- FY Fundraising: $12.9B — standout performer
Key Developments:
- Credit Secondaries Fund I: Final close at $4B — largest inaugural institutional fundraise for Ares; total investment capacity >$7B including leverage
- PE Secondaries wealth vehicle: 13.4% net return for 2025
- Tenth Real Estate Secondaries Fund launched December 2025
Private Equity Group — ACOF VI Top Quartile
- AUM: $25.3B (+5% YoY)
- FRE: $21.1M (+49% YoY)
Performance:
- ACOF VI: Top quartile in vintage, 21%+ gross IRR since inception, 16% net return in 2025
- Portfolio company organic EBITDA growth: 13% LTM
- ACOF VII started generating fees in Q4
How Is the Wealth Channel Performing?
Wealth management was a transformational growth driver in 2025, with semi-liquid product AUM reaching $66B (+69% YoY).
2025 Full Year:
- Equity flows: $16B (up 61% YoY)
- Net flows: $14B
- Q4 flows: $4.1B (second-best quarter ever)
- 7 of 8 semi-liquid strategies now above $2B AUM
2026 YTD (as of early February):
- January flows: ~$1.2B
- February expected: Similar to January
- 95%+ of investors not seeking liquidity
Geographic Mix: Over 30% of capital raised from outside the US over past 2 years, mostly non-APAC (Australia/NZ, Japan).
Management emphasized that even if wealth channel slows modestly, the large institutional drawdown capital base provides deployment flexibility.
Balance Sheet and Financial Strength
Net accrued performance income (unrealized carry) stood at $1,021.4M, up from $957.9M in Q4 2024.
Q&A Highlights
Wealth Channel Flows (Alex Blostein, Goldman Sachs)
Despite concerns about retail pullback, January 2026 flows were $1.2B with similar expectations for February. CEO Arougheti emphasized that "95%+ of all investors are not looking for liquidity" and inflows remain positive across all 8 semi-liquid products. Notably, ACI (core infrastructure) saw $750M inflows in Jan/Feb vs $200M in the prior year period.
Non-Sponsor Lending Growth (Brian McKenna, Citizens)
Non-sponsor originations (family offices, small public companies, entrepreneurs) currently represent ~10% of US direct lending. Target is 15%+ over the next 3-5 years. These deals offer better spreads, lower leverage, and stronger documentation.
Private Equity Expansion (Mike Brown, UBS)
Arougheti addressed recent FT interview comments about potentially acquiring PE capabilities. Key rationale: (1) large allocators want PE exposure, (2) equity ownership skills benefit other strategies, (3) scale needed for wealth/DC distribution. However, "private equity is not a growth business" — it grows episodically, so financial terms must reflect that reality.
ABF Opportunity (Ken Worthington, JPMorgan)
Alternative credit/ABF deployment is ~50/50 between rated and non-rated. Ares has zero exposure to e-commerce aggregators, <1% subprime consumer, and ~1% auto (all prime). A dollar of Pathfinder (non-rated) deployment is worth "significantly more profit dollars" than rated.
Key Quotes From the Call
"We crossed $600 billion in AUM and we exceeded $100 billion in both our 2025 fundraising and investing activities." — Michael Arougheti, CEO
"We enter 2026 with a high level of optimism about the continued success and growth of our business." — Jarrod Phillips, CFO
What About Software/AI Exposure?
Management addressed software exposure concerns head-on given recent market volatility in AI-related equities. CEO Arougheti emphasized their disciplined approach:
Portfolio Exposure:
Risk Mitigation Factors:
- Senior secured loans with lower LTVs (high 30s% vs mid-40s% for rest of portfolio)
- Average portfolio company EBITDA >$350M with 40%+ margins
- Short duration (3-4 years remaining maturity)
- Focus on "foundational infrastructure" software — companies embedded in tech stacks, managing complex workflows, with proprietary data
- Limited exposure to high AI-disruption risk areas like content creation or data visualization
"It would be pretty unlikely that someone who is investing in software has not been underwriting with a primary view as to whether or not there's a risk of disruption." — Michael Arougheti, CEO
Arougheti noted the public equity software index was down ~20% YTD vs. only 2.3% for the broadly syndicated loan software index — reinforcing that "not all software exposure is the same."
Risks and Concerns
-
Private Credit Crowding: Competition in direct lending has intensified, with spreads compressing. Ares' effective management fee rate declined to 0.99% from 1.02% a year ago.
-
Leverage Levels: With $1.38B drawn on the revolver and $2.56B in term debt, total debt is elevated relative to history.
-
Software Valuation Sensitivity: While management downplayed risk, software represents ~12% of direct lending exposure — sector under scrutiny for valuation marks and AI disruption.
-
Stock Down 30% From Highs: Despite strong fundamentals, the stock remains well below its 52-week high, suggesting the market may be pricing in slower growth ahead.
Forward Catalysts
- Fund Closes Q1: Opportunistic Credit III final close ($7B+), plus ~$50M additional European-style performance income visibility
- Non-Traded REIT FRPR: Diversified REIT surpassed high-water mark; Industrial REIT within 2.5% — could generate $79M+ gross FRPR when recovered
- Digital Infrastructure Scale: Data center business flipping from negative FRE to positive contributor in 2026
- US DL Fund IV Launch: First close expected Q4 2026 — one of largest flagship funds
- American-Style Carry: Potential modest realizations from $123M net accrued balance in H2 2026 if M&A backdrop continues improving